How to Add a Matplotlib Title
Learn via video courses
Overview
Matplotlib is a data visualization library in Python. The Matplotlib title() function is used to specify titles to the 2D graphs plotted using matplotlib.pyplot. The title() function can also be used to change the color, size, font, alignment, etc., of the title.
Scope
- In this article, we will learn to add titles to graphs using the title() function in Matplotlib.
- The syntax, parameters, and return value will also be discussed for the title() function.
- We will also learn how to change the color, size, font, and many more properties of a graph title using the title() function in this article.
What are Matplotlib Titles?
Matplotlib titles are the titles of 2D graphs plotted using matplotlib.pyplot. They are used to name the graphs for identification and explanation purpose. We can also alter the title's color, size, font, location, alignment, etc., using the pyplot.title() function.
How to Add a Matplotlib Title to a Plot
To add a title to a plot, we have to first import pyplot from the matplotlib library.
Mandatory statement to use Matplotlib functions:
We will name pyplot as in this article because it is conventional, but any other name can be used as per your choice.
Syntax of Matplotlib Title
The syntax of title() function in matplotlib is
The is written with title() as it is a pytplot function.
Parameters of Matplotlib Title
The plt.title() function has the following parameters
| Parameters | |
|---|---|
| label | It refers to the title/name of the graph. It is of string type. |
| fontdict (optional) | It is a dictionary used to specify fontsize, fontweight, and alignment. |
| loc (optional) | This parameter refers to the location of the title, it can be left, center, and right. The location is center by default. |
| pad (optional) | It is used to add padding to the title and is by default. |
| kwargs (optional) | This parameter refers to the use of the keyword arguments such as color, fontstyle, backgroundcolor, linespacing, rotation, etc. |
Return type of Title in Matplotlib
The title() function returns a string that represents the title text of the plot.
Examples of Title in Matplotlib
Example 1: Adding Title to a Matplotlib
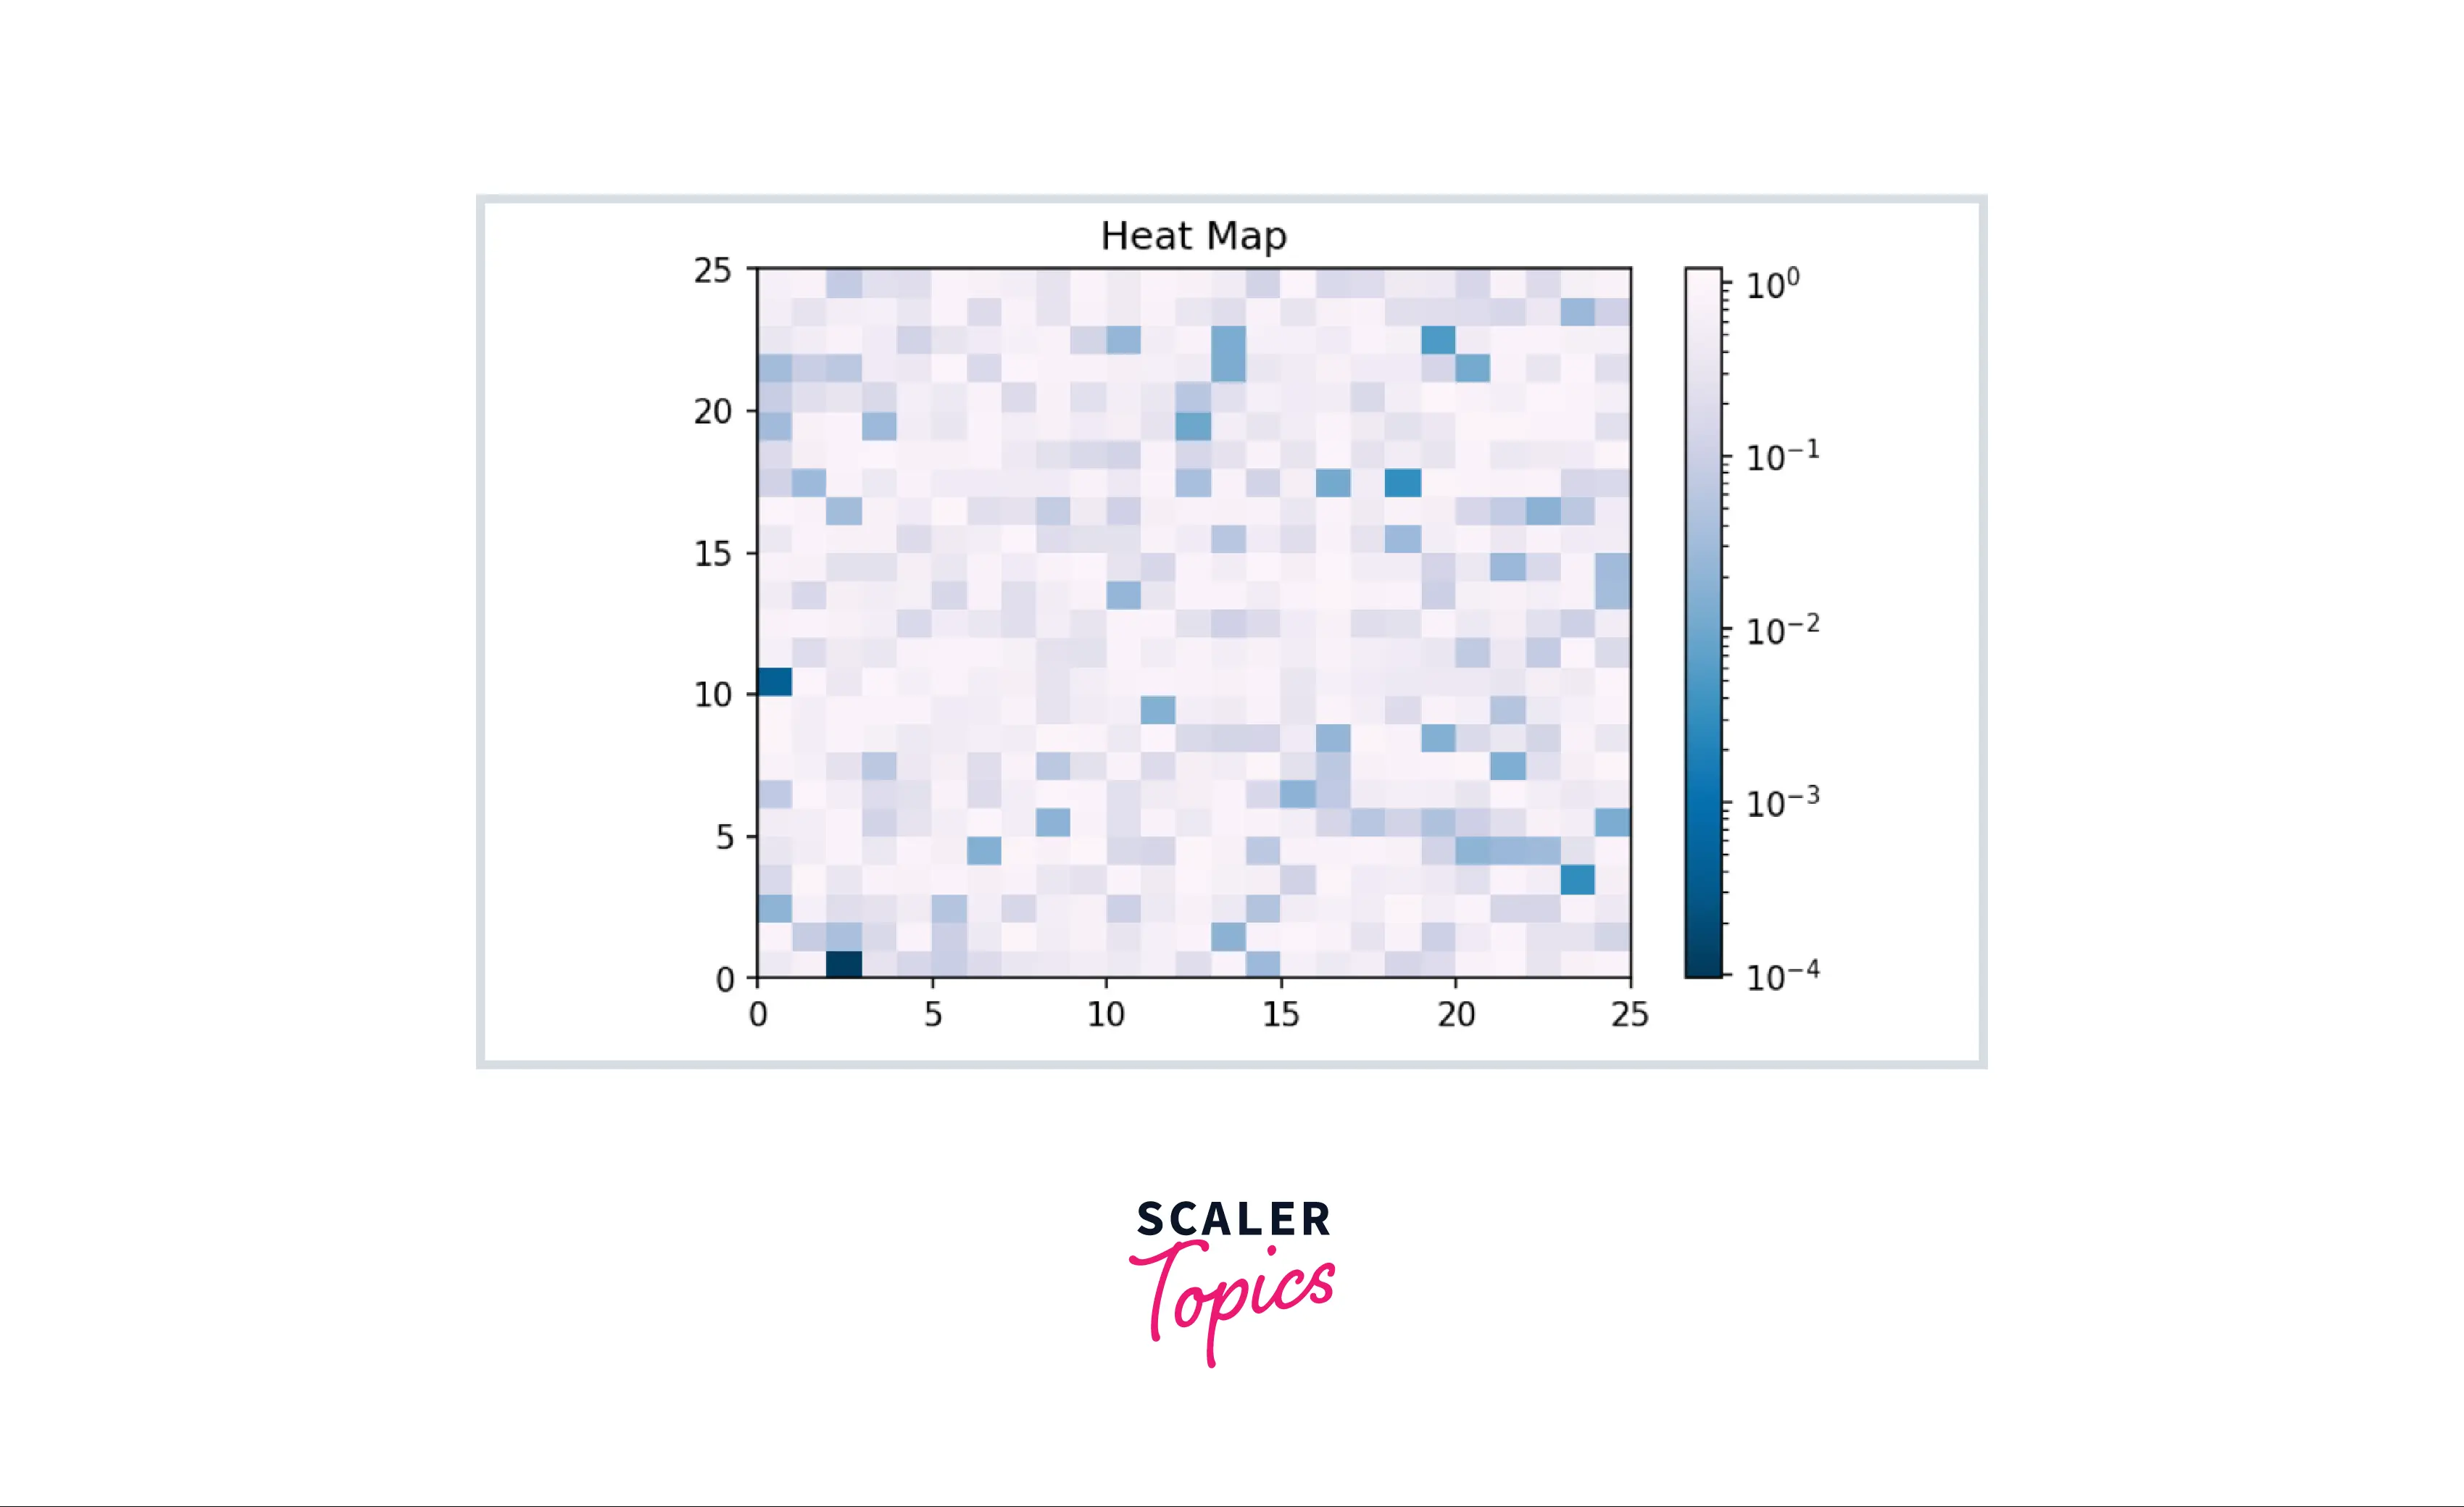
In this example, we will add a title over a matplotlib visualization.
This can be done by passing a string to the plt.title() method.
Output:

In the above example, we are adding a title text over the visualization using the title() function. As you can see in the output above, the visualization has the title 'Heat Map' above it. The title text is in the center because the loc parameter is 'center' by default.
Example 2: Changing the Font size, Colour, and Location of the Title
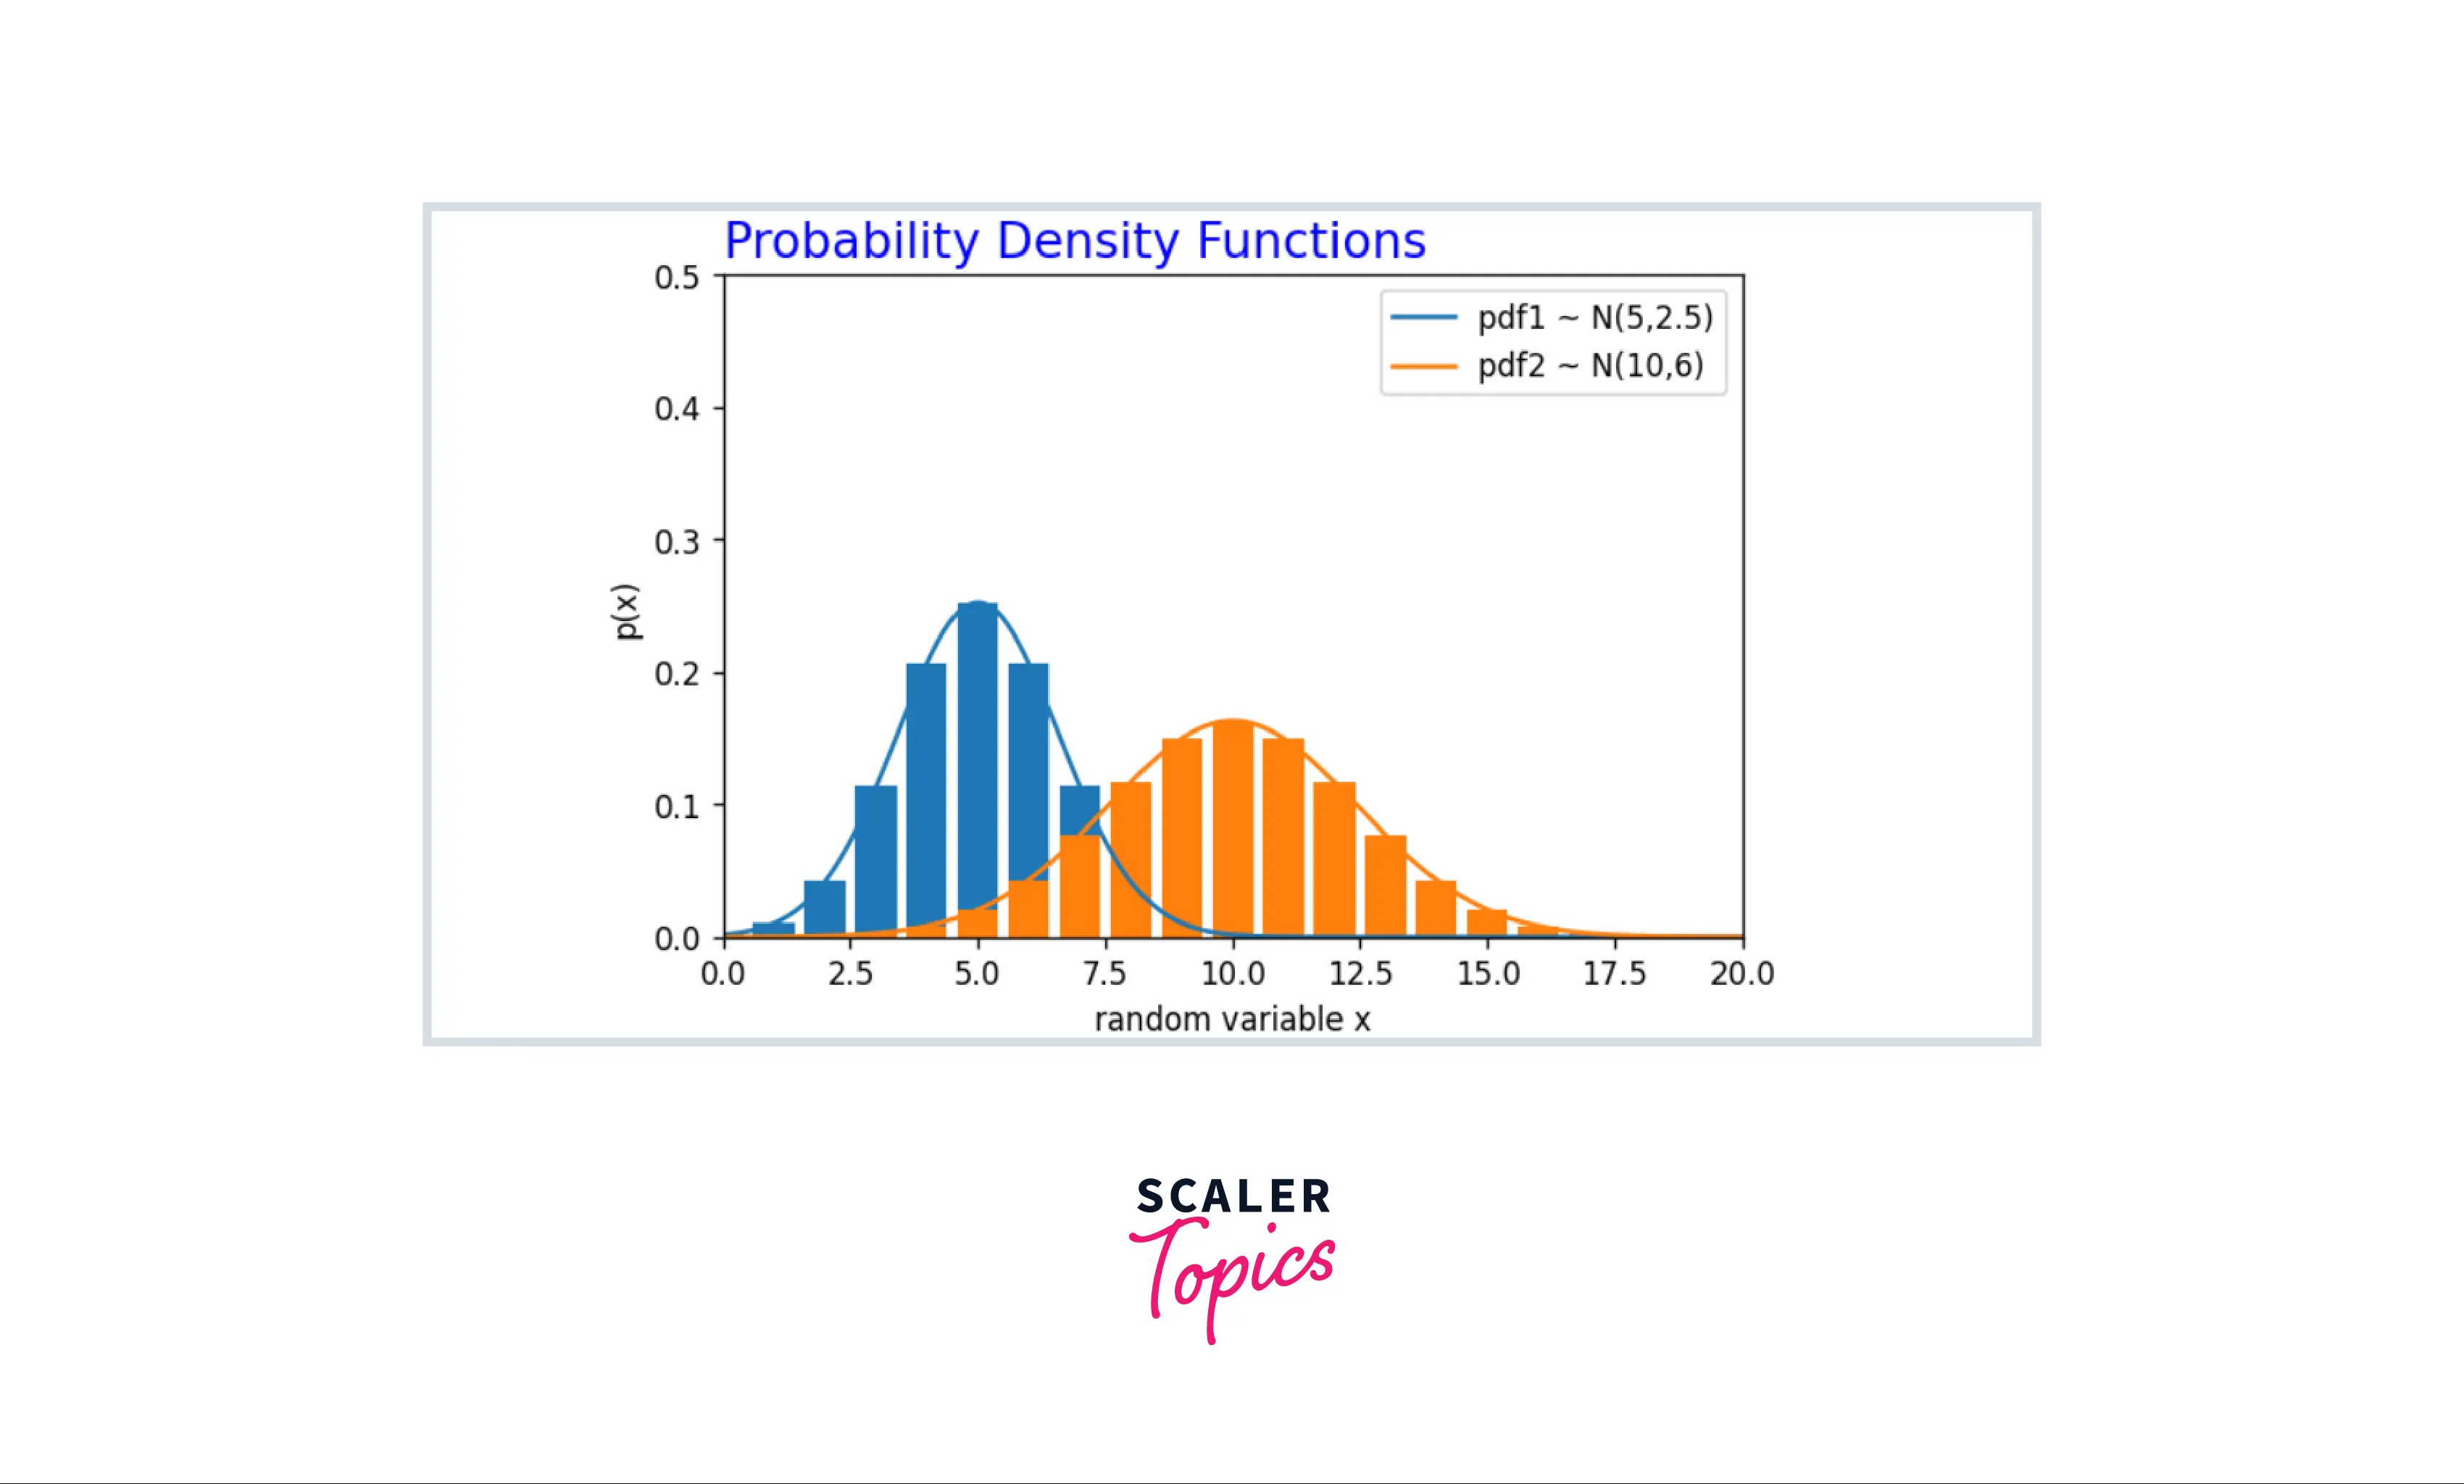
To change the font size of the title text, the fontsize argument is used and is assigned the size in integer units. The color can be changed by assigning the color argument the desired color. We can also use hex code symbols. The location of the title text can be changed by assigning the loc argument any of these three values: left | center | right.
Output:

In the above example, we are adding a title text over the visualization using the title() function. As you can see in the output above, the graph has the title 'Probability Density Functions' above it.
The title text is of size , blue colored, and on the left of the graph as we have specified the fontsize, color and loc arguments to be , 'blue' and 'left'.
Example 3: Changing the Alignment of the Title
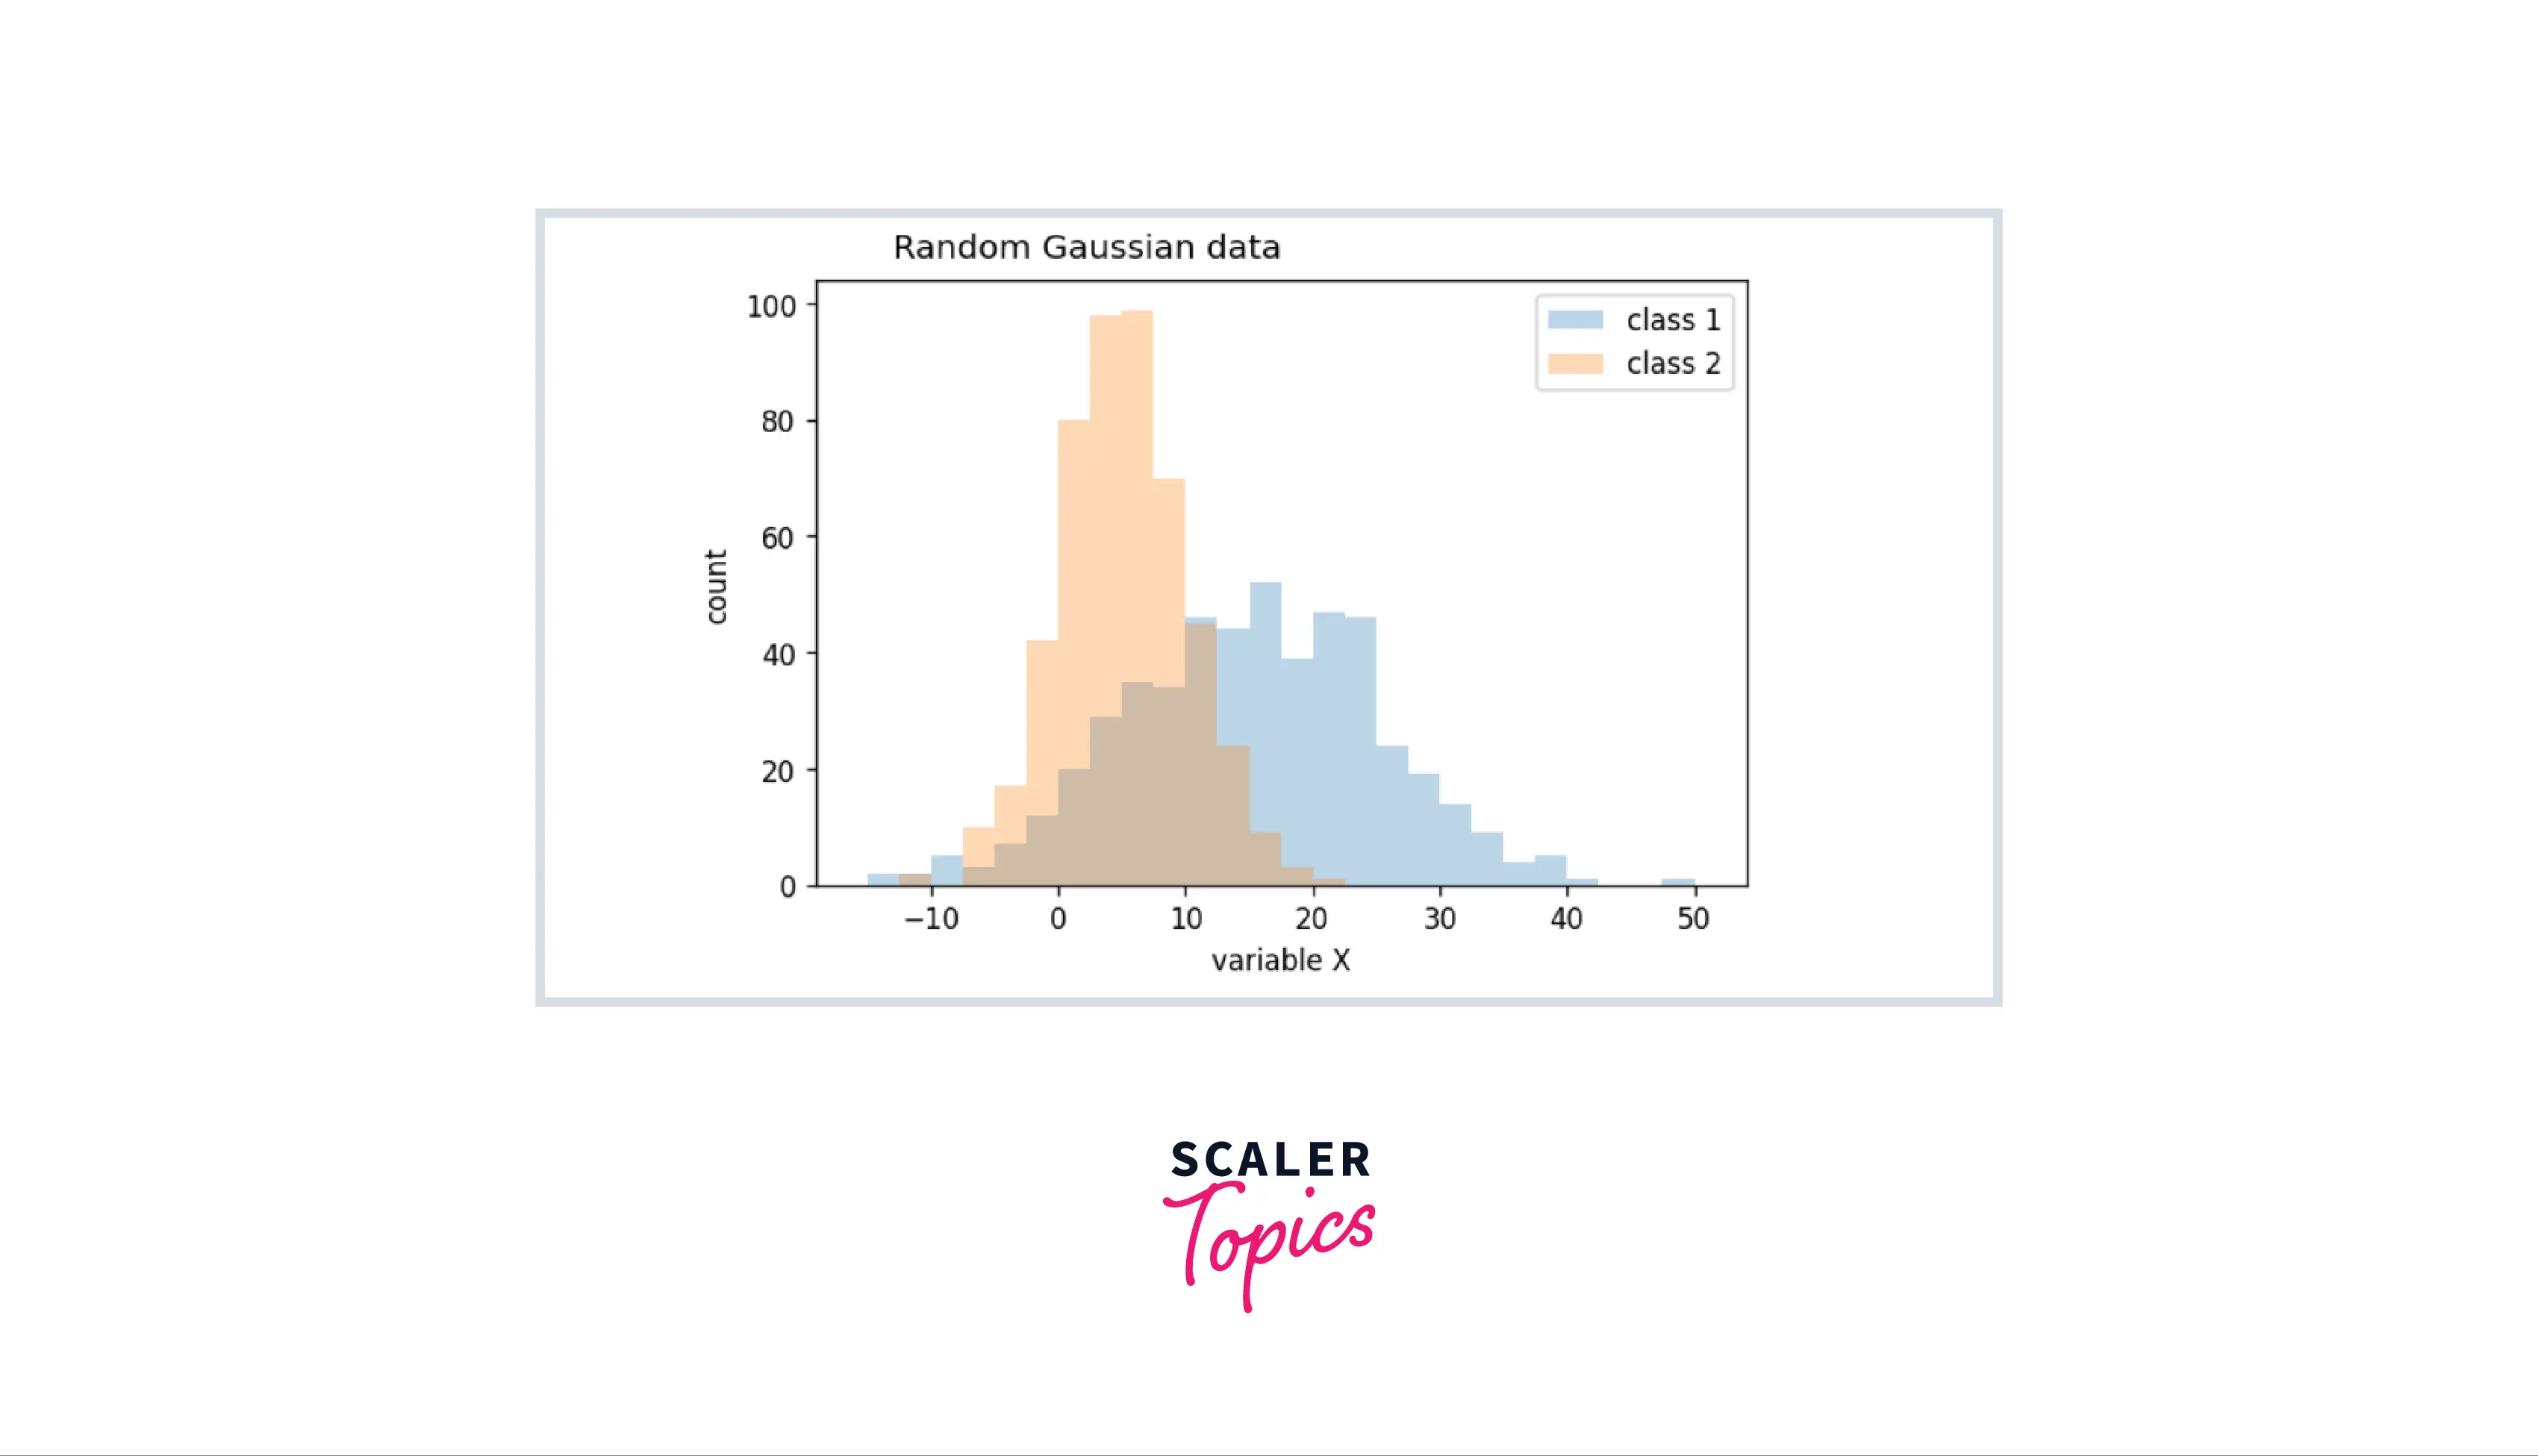
The alignment of the title text can be changed by using the ha and va arguments.
| Argument | Values |
|---|---|
| ha | center | right | left |
| va | serif | sans-serif | cursive | fantasy | monospace |
Output:

In the above example, we are adding a title text over a histogram using the title() function. As you can see in the output above, the histogram has the title 'Random Gaussian Plot' above it.
The title text is aligned right to the horizontal axis using the ha argument and is aligned bottom to the vertical axis using the va argument.
Example 4: Adding Background Color and Padding to the Title
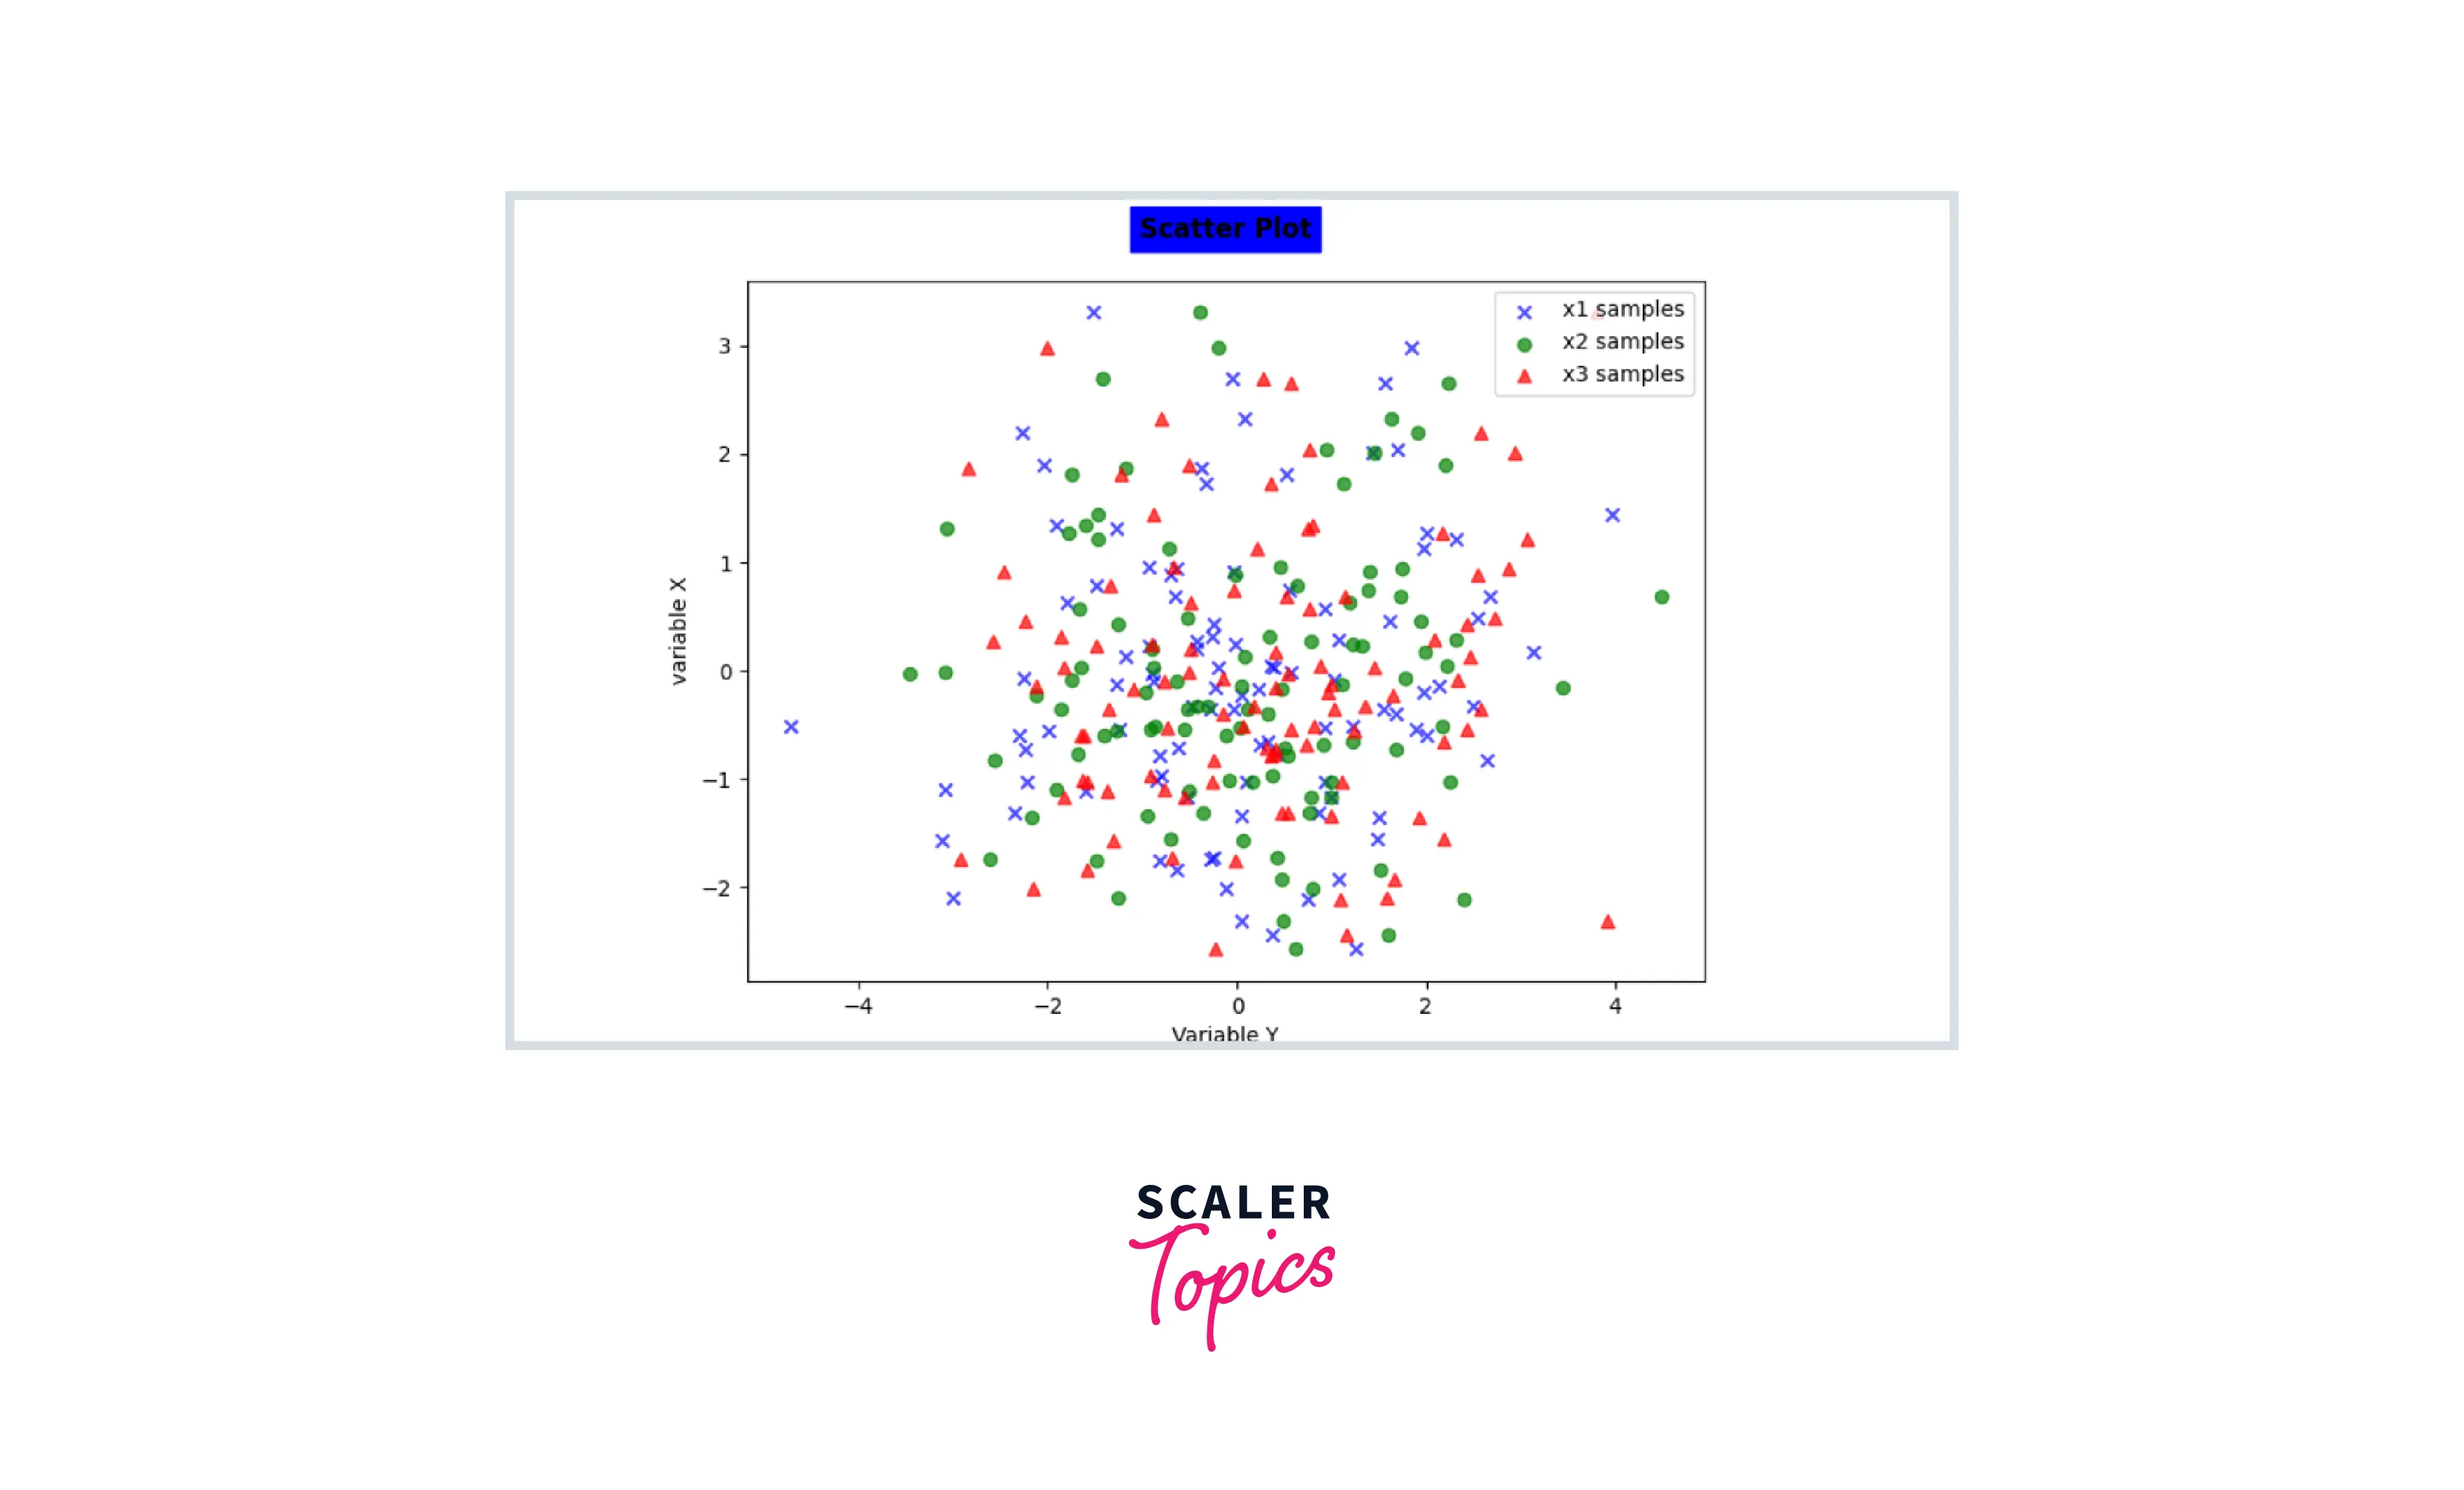
The background color of the title text can be changed by assigning the backgroundcolor argument the desired color, we can also use hex code symbols.
To add padding to the title text, the pad argument is used and is assigned the size in integer units.
Output:

In the above example, we are adding a title text over a scatter plot using the title() function. As you can see in the output above, the scatter plot has the title 'Scatter Plot' above it.
The title text is given a bold fontweight using the fontweight=bold argument, a blue background colour using the backgroundcolor=blue, and padding of using the padding=20 argument.
Conclusion
- The matplotlib title() function is used to add a title to 2D graphs plotted using Matplotlib.
- The pyplot must be imported from matplotlib before we can use the title() function in Python.
- We can change the color, font size, font style, and many more properties of a title using the title() function.
